Concepts
Text/corpus data - your input is needed!
ydata-profiling team is considering the support of a new set of features for corpus data
and we want to hear from you! We're particularly interested in understanding why you think
these features would be useful, and your input will help us prioritize and refine this development.
👉 Upvote [add here link for the request form]
Data Structures supported
The profiling offers comprehensive insights into various types of data, including tabular, time-series text and image data.
- Tabular data: when dealing with tabular data, such as spreadsheets or databases, the profiling provides valuable statistics on data distribution, central tendencies, and categorical variable frequencies. It identifies multivariate relations such as correlations and interactions in a visual manner. It also identifies missing data.
- Time-series data: when dealing with data with temporal dimensions, the profiling extends its capabilities to capture trends, seasonality, cyclic patterns and missing data gaps. It can reveal information about data volatility, periodicity, and anomalies, facilitating a deeper understanding of time-dependent trends.
- Text: when it comes to text data, such as strings or documents, the profiling offers insightful statistics on the distribution of word frequencies, common phrases, and unique words.
Data types
Types, when going beyond the logical data types such as integer, floats, etc, are a powerful abstraction for effective data analysis, allowing analysis under higher level lenses. ydata-profiling is backed by a powerful type system developed specifically for data analysis: visions <https://github.com/dylan-profiler/visions>_. Currently, ydata-profiling recognizes the following types:
- Boolean
- Numerical
- Date (and Datetime)
- Categorical
- Time-series
- URL
- Path
- File
- Image
Appropriate typesets can both improve the overall expressiveness and reduce the complexity of the analysis/code.
User customized summarizations and type definitions are fully supported, with PRs supporting new data types
for specific use cases more than welcome. For reference, you can check the implementation of ydata-profiling's
default typeset here.
Data quality alerts
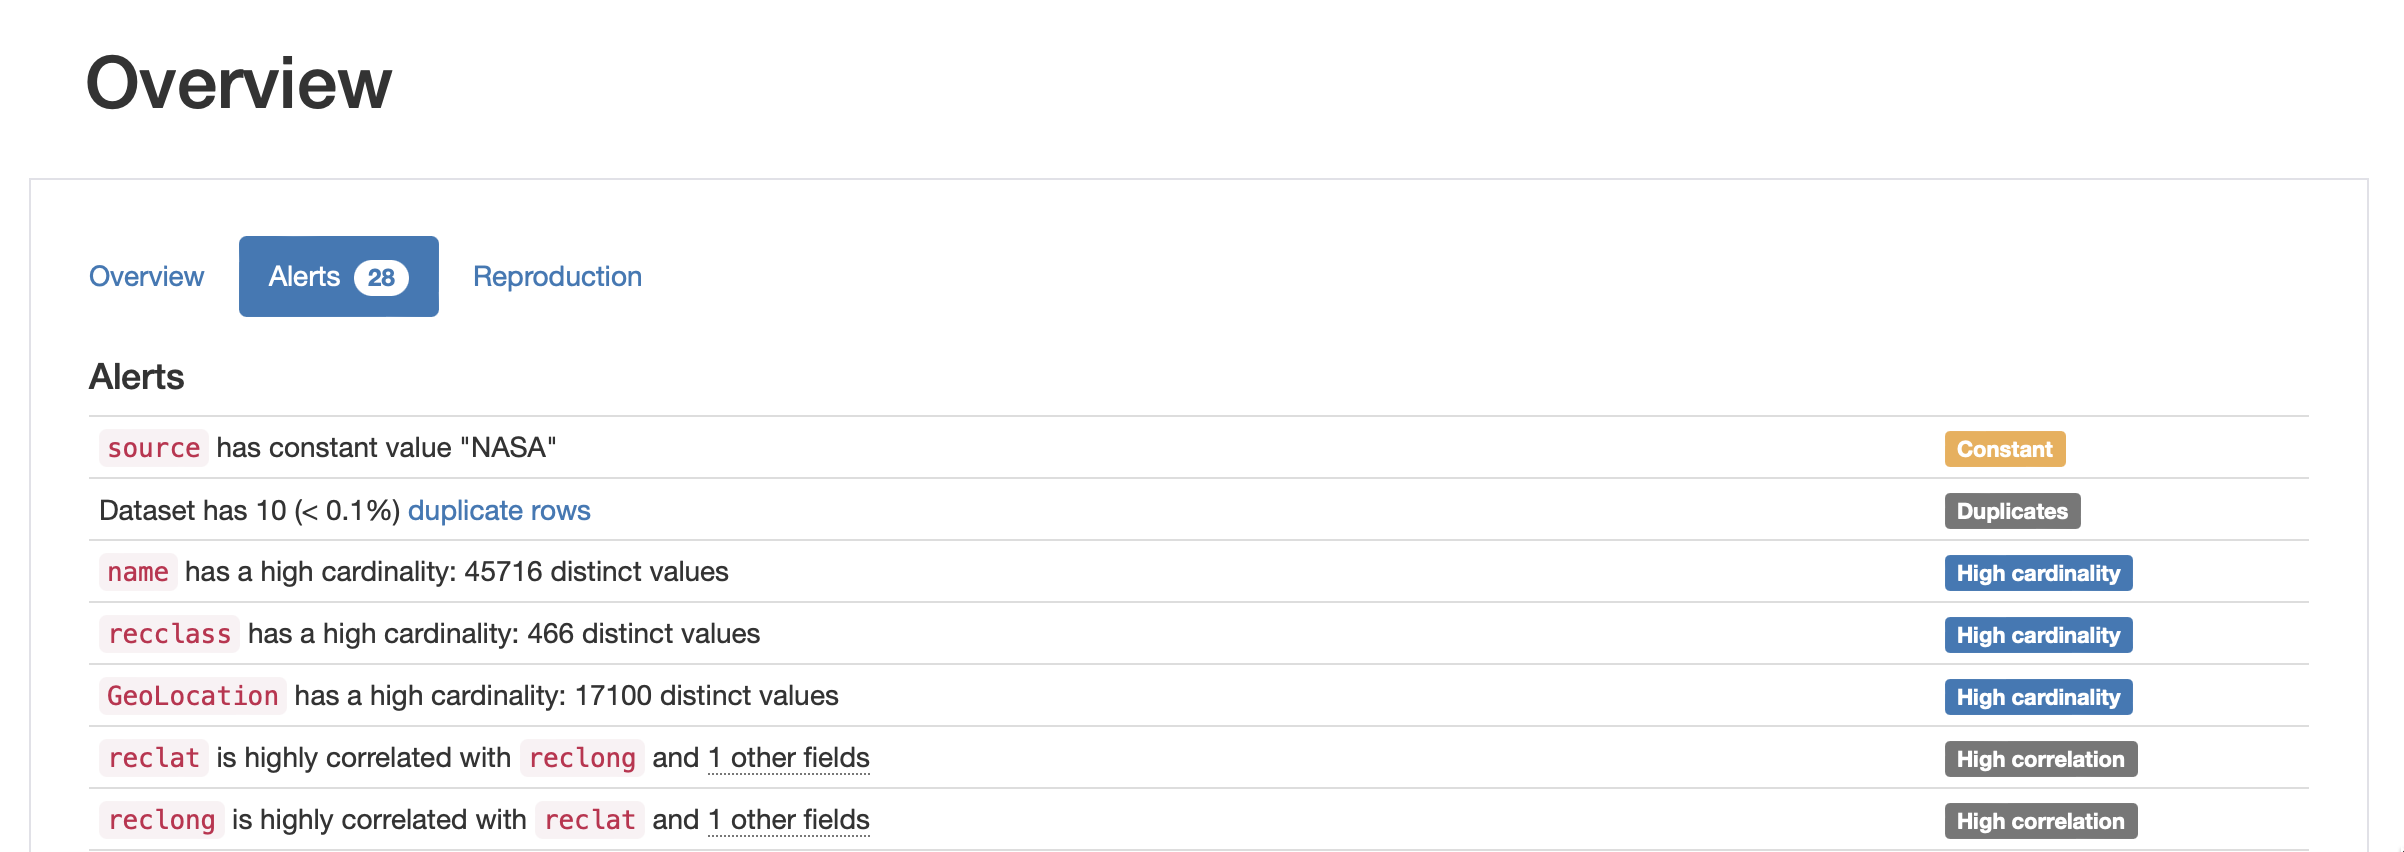
Alerts section in the NASA Meteorites dataset's report. Some alerts include numerical indicators.
The Alerts section of the report includes a comprehensive and automatic list of potential data quality issues. Although useful, the decision on whether an alert is in fact a data quality issue always requires domain validation. Some warnings refer to a specific column, others refer to inter-column relationships and others are dataset-wide. The table below lists all possible data quality alerts and their meanings.
| Alert | Description |
|---|---|
Constant |
Column only contains one value |
Zeros |
Column only contains zeros |
High Correlation |
Correlations (either Spearman, Cramer, Pearson, Kendall, 𝜙k) are above the warning threshold (configurable). |
High Cardinality |
Whether the column has more than 50 distinct values. Threshold is configurable. |
Imbalance |
Column is highly imbalanced. Threshold is configurable. |
Skewness |
Column's univariate distribution presents skewness. Threshold value is configurable. |
Missing Values |
Column has missing values |
Infinite Values |
Column has infinite values (either np.inf or -np.inf) |
Unique Values |
All values of the column are unique (count of unique values equals column's length) |
Seasonal |
Column has seasonal pattern |
Non Stationary |
Column is a time-series non-stationary |
Date |
Column (likely/mostly) contains Date or Datetime records |
Uniform |
Column follows a uniform distribution (Chi-squared test score > 0.999, threshold score is configurable) |
Constant length |
For strings/date/datetimes columns whose entries all have the same length |
Rejected |
Variable has mixed types or is constant (thus not suitable for meaningful analysis) |
Unsupported |
Column can't be analysed (type is not supported, has mixed types, has lists/dicts/tuples, is |
| empty, wrongly formatted) | |
Duplicates |
Dataset-level warning signaling the presence of more than 10 duplicated records. |
Empty |
Dataset-level warning signaling there's no data to be analysed. |
Information on the default values and the specific parameters/thresholds used in the computation of these alerts, as well as settings to disable specific ones, can be consulted in the documentation.
Univariate profiling
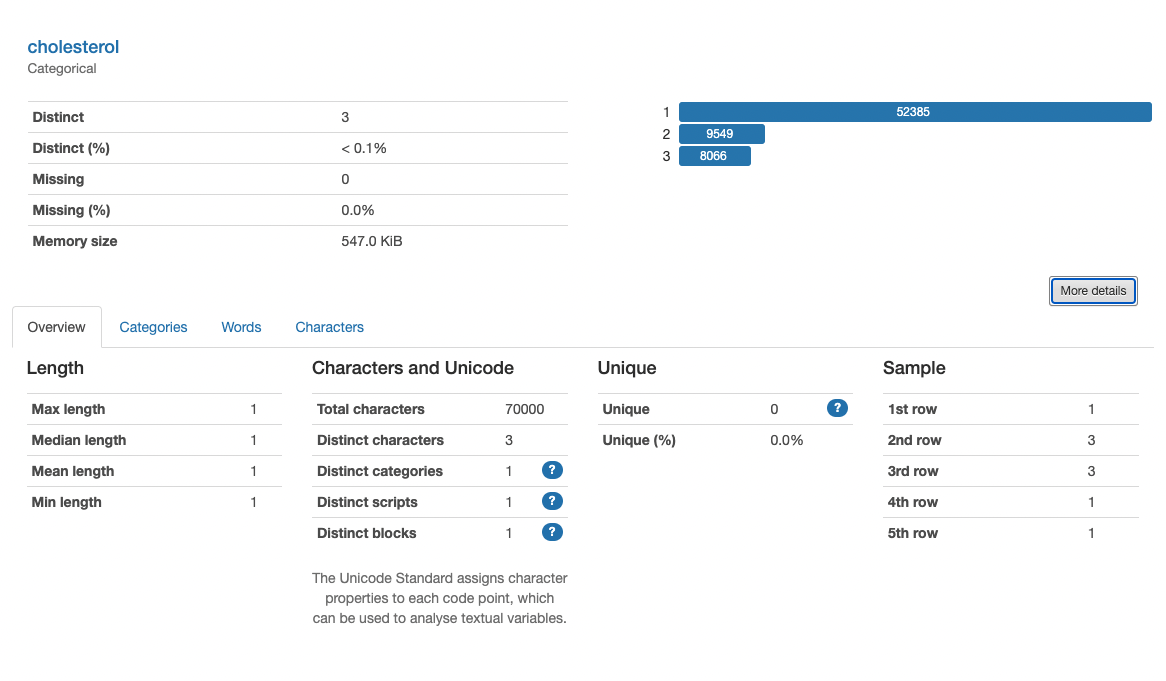
This section provides a comprehensive overview of individual variables within a given dataset, this feature is particularly useful for exploratory data analysis (EDA) as it automatically calculated detailed statistics, visualizations, and insights for each variable in the dataset. It offers information such as data type, missing values, unique values, basic descriptive statistics , histogram plots, and distribution plots. This allows data analysts and scientists to quickly understand the characteristics of each variable, identify potential data quality issues, and gain initial insights into the data's distribution and variability.
For more details about the different metrics and visualizations check the Univariate section details page.
Multivariate profiling
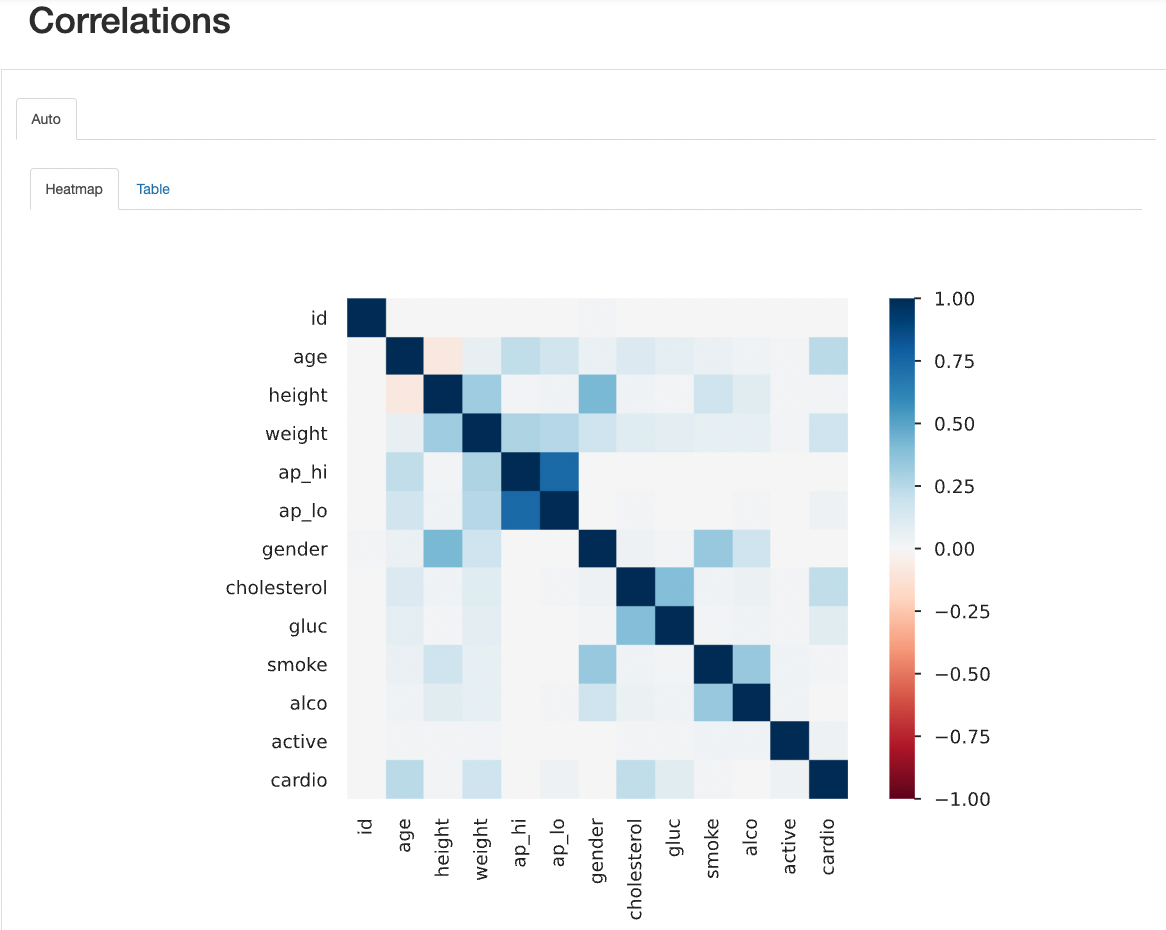
This section provides essentials insights into the relationships between variables through correlations matrices and interactions. The correlation view computes and presents correlation coefficients between pairs of numerical variables, helping to identify potential linear relationships. This assists data analysts and scientists in understanding how variables change together and highlights possible multicollinearity issues.
On the other hand, the interactions section goes beyond correlation by exploring potential nonlinear relationships and interactions between variables, providing a more comprehensive understanding of how variables interact with one another. This can be crucial in identifying hidden patterns that might not be captured through traditional correlation analysis.
Check the section about interactions configuration and correlation matrix metrics for more details.
Missing data
This section offers valuable insights into the presence and distribution of missing data within a dataset. It can be particularly helpful for data preprocessing and quality assesment as provides a comprehensive summary of missing values across variables, indicating the percentage of missing data for each variable. Additionally, it displays a visual representation of missing data patterns through bar plots and heatmaps, allowing users to quickly identify which variables have the most significant amount of missing information.
Check how you can configure your missing data visualization.
Outliers **
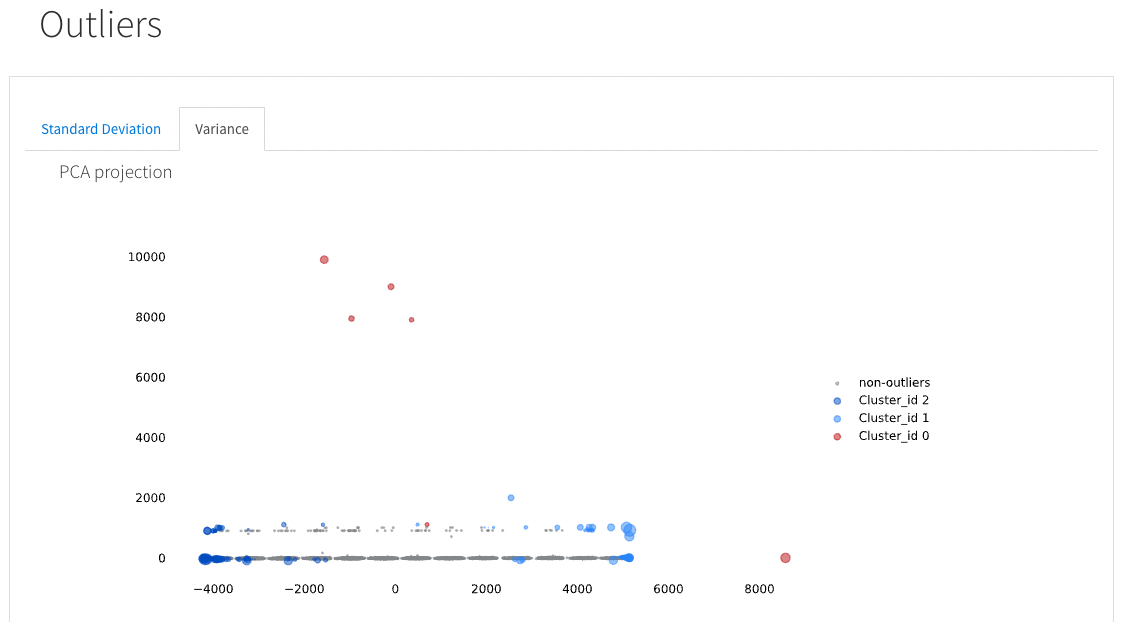
This section provides a comprehensive profiling over the potential dataset outliers. You can validate and observe outliers presence and deviation from the general distribution of numerical variables based on observed variance. The identification of outliers allows the data analyst or scientist to assess whether they are genuine data anomalies or erroneous entries, allowing for informed decisions on whether to retain, transform, or exclude these points in further analyses.
Feature limited to user of the cloud hosted solution.
Preview data
For a quick overview of the data, ydata-profiling provides the following sections that can be easily configure by the user: - First n records of a given dataset - Last n records of a given dataset - A table containing observed duplicates (exact matches)
